Twenty-two South African airports have an IATA code and scheduled passenger flights. Nine of them are run by Airports Company South Africa and file monthly passenger returns; those nine carried 41,135,224 passengers in the 2025/26 financial year. Each has a page here, built on its own filings rather than on a press release.
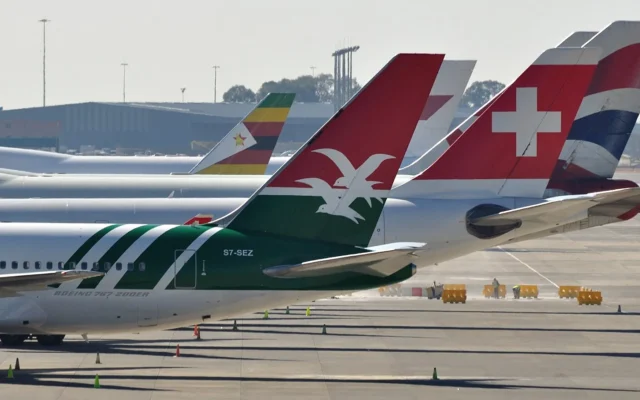
JNBFAOR
O. R. Tambo
Johannesburg, Gauteng
20,083,399passengers, FY2025/26
41% international
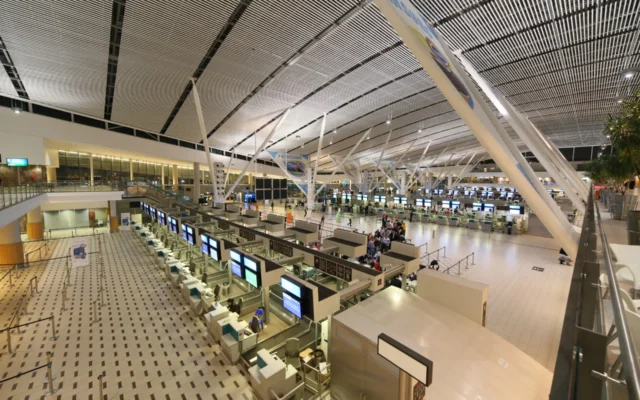
CPTFACT
Cape Town
Cape Town, Western Cape
11,333,736passengers, FY2025/26
28% international
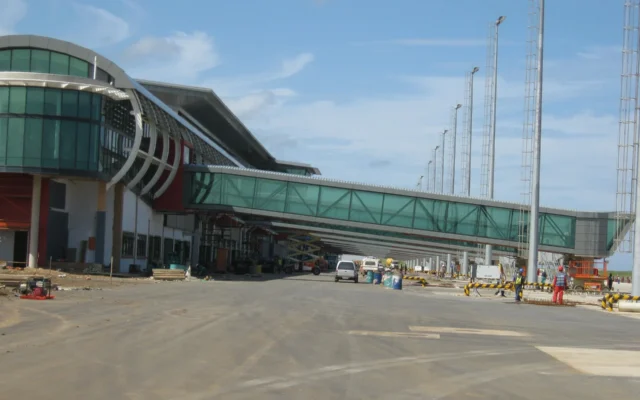
DURFALE
King Shaka
Durban, KwaZulu-Natal
5,616,199passengers, FY2025/26
5% international
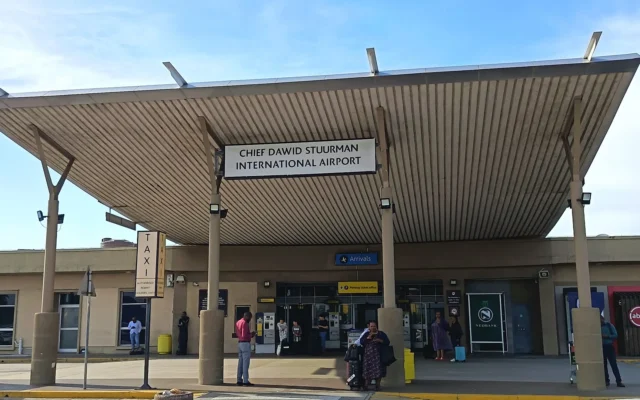
PLZFAPE
Chief Dawid Stuurman
Gqeberha, Eastern Cape
1,586,070passengers, FY2025/26
no international flights
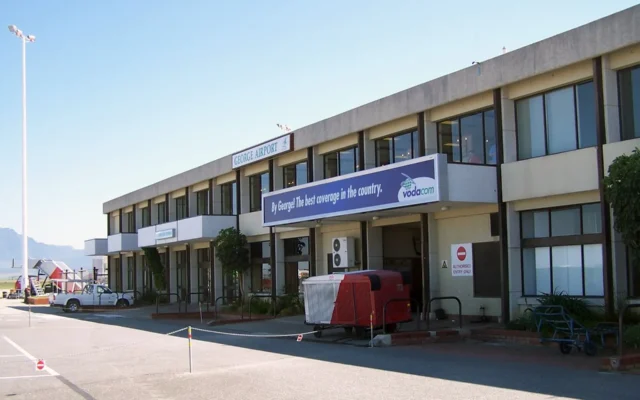
GRJFAGG
George
George, Western Cape
939,332passengers, FY2025/26
no international flights
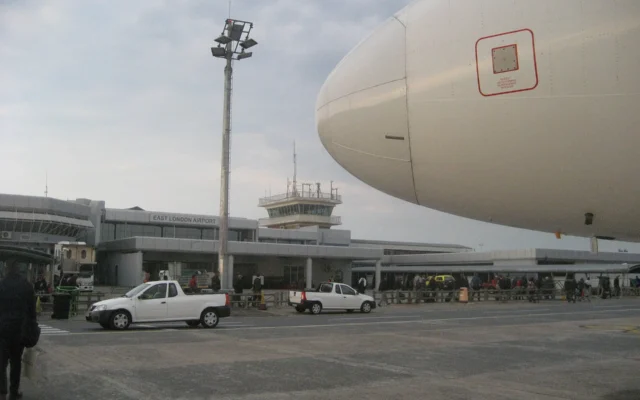
ELSFAEL
King Phalo
East London, Eastern Cape
911,738passengers, FY2025/26
no international flights
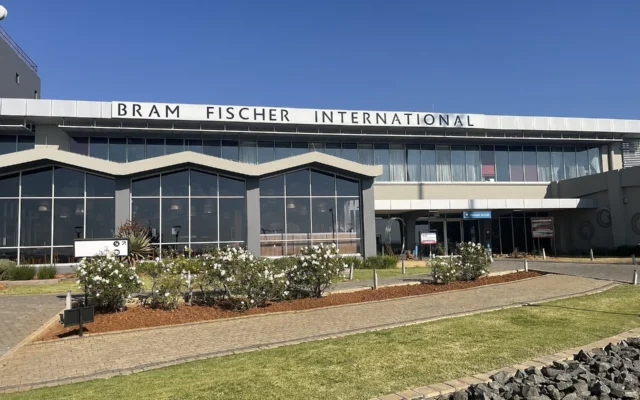
BFNFABL
Bram Fischer
Bloemfontein, Free State
431,359passengers, FY2025/26
no international flights
KIMFAKM
Kimberley
Kimberley, Northern Cape
170,738passengers, FY2025/26
no international flights
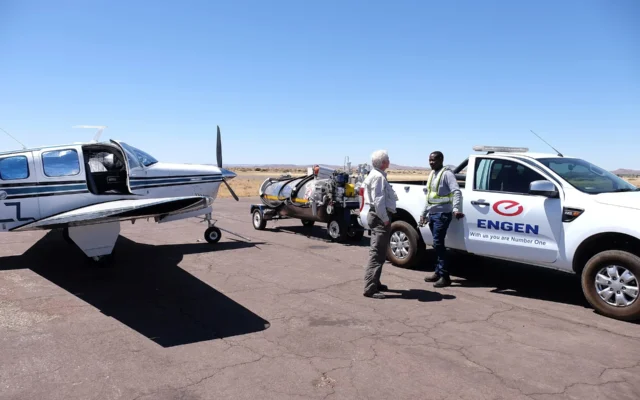
UTNFAUP
Upington
Upington, Northern Cape
62,653passengers, FY2025/26
no international flights
HLAFALA
Lanseria
Johannesburg, Gauteng
0passengers, FY2025/26
no international flights
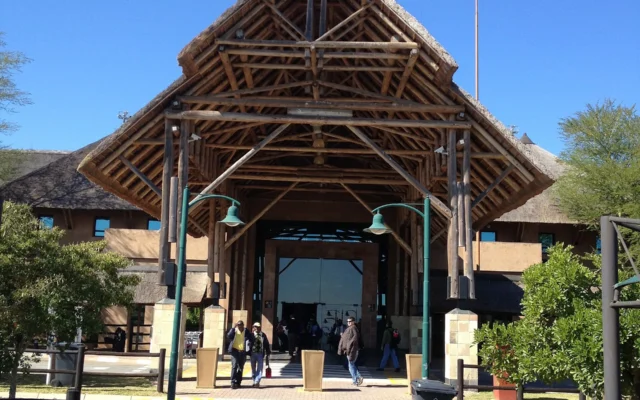
MQPFAKN
Kruger Mpumalanga
Mbombela, Mpumalanga
0passengers, FY2025/26
no international flights
HLA
Lanseria
Johannesburg, Gauteng
—privately run, no public filings
MQP
Kruger Mpumalanga
Mbombela, Mpumalanga
—privately run, no public filings
Three airports carry nine in ten passengers
O. R. Tambo, Cape Town and King Shaka between them moved 37,033,334 of the network’s 41.1 million passengers — 90 per cent. Everything else is, in practice, a connection.
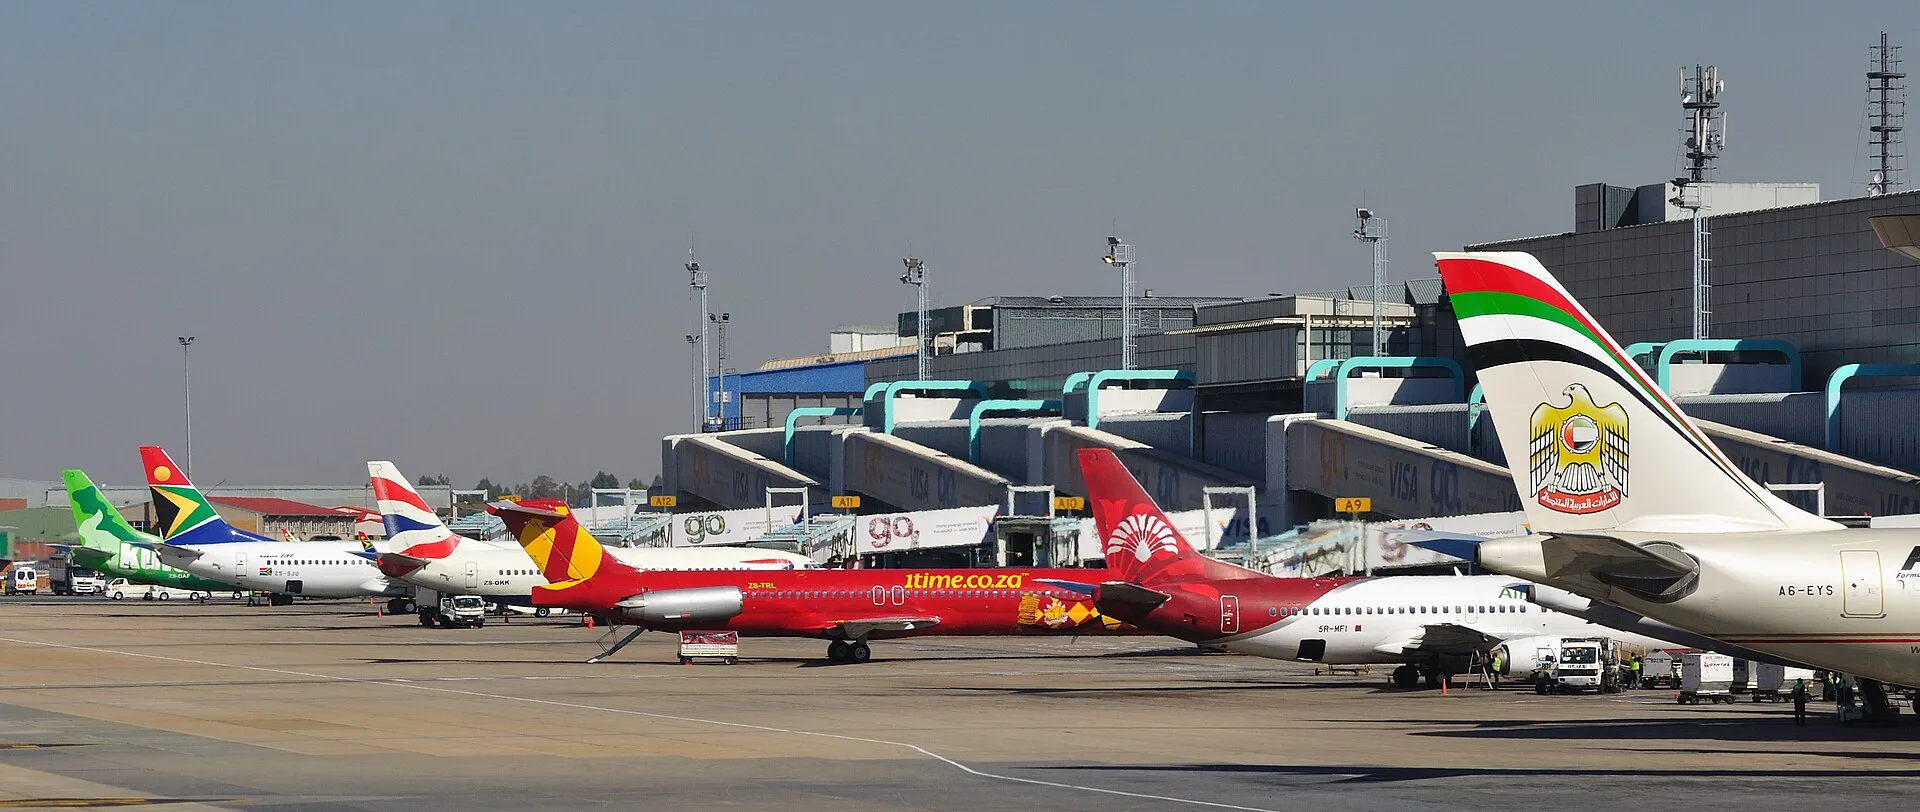
JNBBusiest in Africa
O. R. Tambo
Johannesburg, Gauteng
The continent's main long-haul interchange, and the only South African airport with a rail link into the city. Two terminals under one roof, eight to ten minutes' walk apart, and the only one of the nine where more than a third of passengers are international.
FY2025/2620,083,399
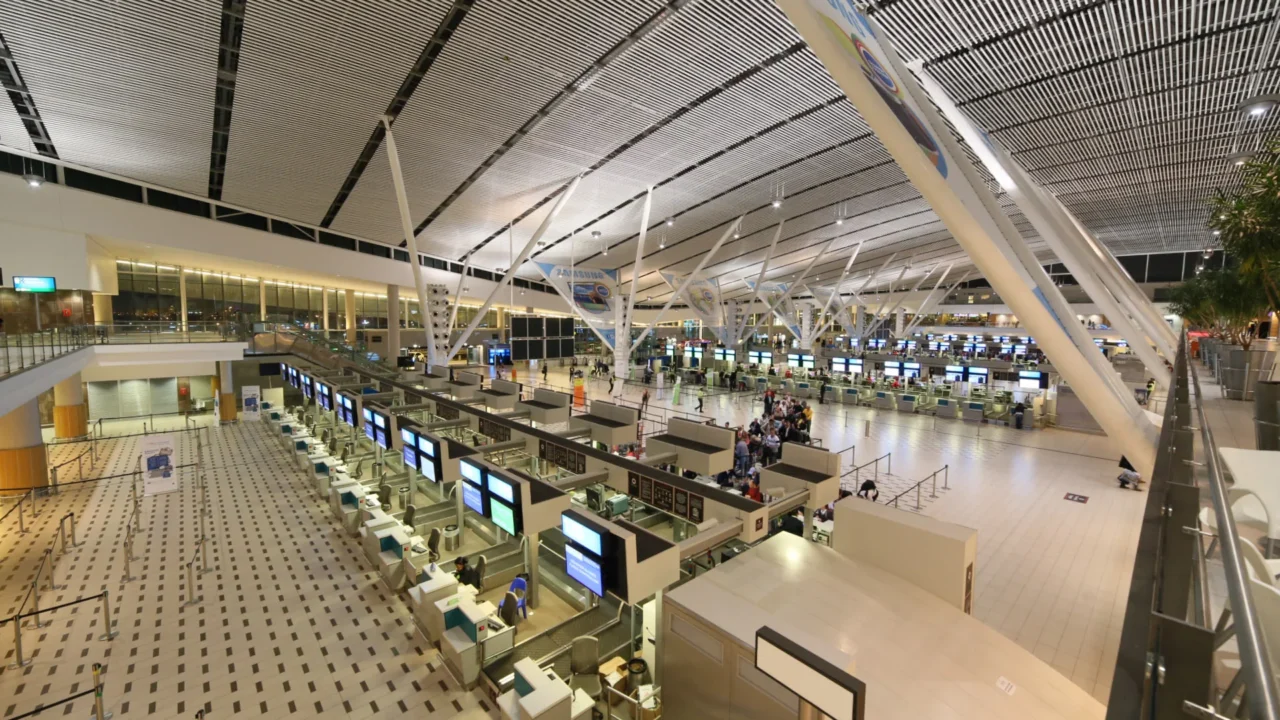
CPTFastest growing
Cape Town
Cape Town, Western Cape
One terminal, two piers, and the shortest connections in the country.
FY2025/2611,333,736
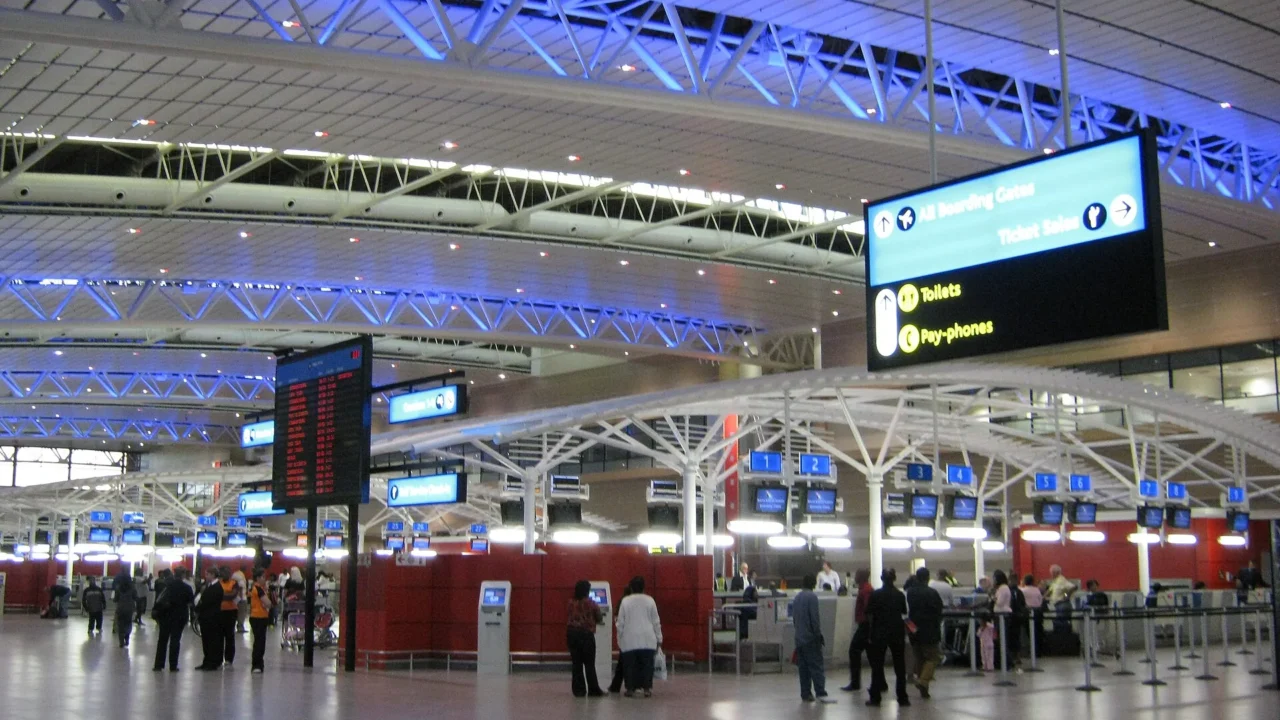
DURBuilt with room to grow
King Shaka
Durban, KwaZulu-Natal
Opened in 2010 and overwhelmingly domestic: barely one passenger in twenty flies international.
FY2025/265,616,199
Only three see international passengers
This is the single most useful thing to understand before booking, and almost nobody states it plainly. In 2025/26, scheduled international traffic was recorded at exactly three of the nine: O. R. Tambo (8,196,340), Cape Town (3,128,631) and King Shaka (296,387). Chief Dawid Stuurman in Gqeberha recorded 70 international passengers for the entire year. George, East London, Bram Fischer, Kimberley and Upington recorded none at all.
Several of those airports are still called “International” in their official names. That reflects customs facilities rather than a current route network.
The coast peaks in December. The interior peaks in March.
Six of the nine are busiest in December, driven by the southern-hemisphere summer holidays and the coastal exodus. The three inland airports — Bram Fischer, Kimberley and Upington — peak in March instead, because their traffic follows the business and agricultural calendar rather than the school year.
The size of that swing also varies far more than people expect. Upington moves 76 per cent between its best and worst month; O. R. Tambo only 31. Each airport page carries its own month-by-month figures.
All twenty-two airports
Thirteen more airports have an IATA code and scheduled service but file no public monthly returns. Several matter a great deal to the traveller even though they move comparatively few people: Skukuza is inside the Kruger National Park, Hoedspruit serves the private reserves, and Lanseria is a serious alternative to O. R. Tambo for anyone staying north of Johannesburg.
| IATA | ICAO | Airport | City | Province | Operator |
|---|---|---|---|---|---|
| JNB | FAOR | O. R. Tambo International | Johannesburg | Gauteng | ACSA |
| CPT | FACT | Cape Town International | Cape Town | Western Cape | ACSA |
| DUR | FALE | King Shaka International | Durban | KwaZulu-Natal | ACSA |
| PLZ | FAPE | Chief Dawid Stuurman International | Gqeberha | Eastern Cape | ACSA |
| GRJ | FAGG | George | George | Western Cape | ACSA |
| ELS | FAEL | King Phalo | East London | Eastern Cape | ACSA |
| BFN | FABL | Bram Fischer International | Bloemfontein | Free State | ACSA |
| KIM | FAKM | Kimberley | Kimberley | Northern Cape | ACSA |
| UTN | FAUP | Upington International | Upington | Northern Cape | ACSA |
| HLA | FALA | Lanseria International | Johannesburg | Gauteng | Private |
| MQP | FAKN | Kruger Mpumalanga International | Mbombela | Mpumalanga | Private |
| SZK | FASZ | Skukuza | Skukuza, Kruger National Park | Mpumalanga | SANParks |
| HDS | FAHT | Eastgate | Hoedspruit | Limpopo | Other |
| PHW | FAPH | Hendrik Van Eck | Phalaborwa | Limpopo | Other |
| PTG | FAPP | Polokwane International | Polokwane | Limpopo | Other |
| UTT | FAUT | K. D. Matanzima | Mthatha | Eastern Cape | Other |
| PZB | FAPM | Pietermaritzburg | Pietermaritzburg | KwaZulu-Natal | Other |
| RCB | FARB | Richards Bay | Richards Bay | KwaZulu-Natal | Other |
| MGH | FAMG | Margate | Margate | KwaZulu-Natal | Other |
| MZQ | FAMU | Mkuze | Mkuze | KwaZulu-Natal | Other |
| MBD | FAMM | George Dick Montshioa | Mahikeng | North West | Other |
| SIS | FASS | Sishen | Sishen | Northern Cape | Other |
Where the numbers come from
Airports Company South Africa publishes a passenger-movement statement for each of its nine airports, monthly, back to the 2012/13 financial year, split by international, regional, domestic and unscheduled traffic. We read those statements directly and check that the four categories add up to the printed total before publishing anything. For all nine airports in 2025/26 they reconcile to the passenger.
Lanseria and Kruger Mpumalanga are privately run and file nothing comparable, so their cells stay empty. Estimates for both circulate widely and we do not repeat them. The full sourcing note.